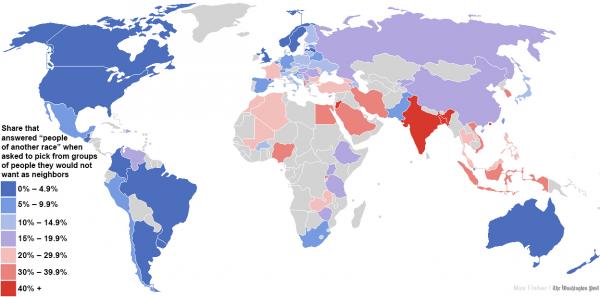
Highlighting India's racist bent?
The Washington Post has an article based on a study conducted by a couple of Swedes on racial intolerance across the world. Te resulting infographic highlights India and Bangladesh as being two of the most racially intolerant places in the world. Then again, seeing Pakistan all in blue is surprising. But seeing as to how this is about racial intolerance rather its religious cousin, perhaps this could be explained.
- Read more about Highlighting India's racist bent?
- Log in to post comments
